| Contribute to industrial competitiveness |
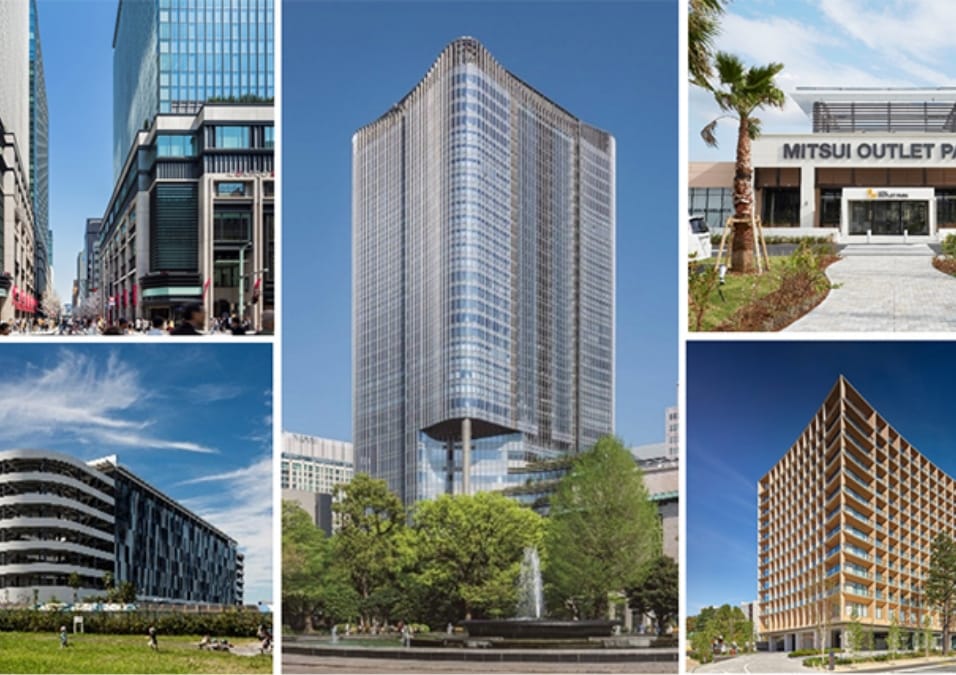
Strengthening industrial competitiveness
'Initiatives that contribute to the creation of added value for society by supporting people's lifestyles and diverse corporate activities.'
|
Annual disclosure of initiatives |
- |
- |
- |
- |
- |
・Selected for the CDP Climate A List, the highest ranking, for the second year in a row, and as a Supplier Engagement Leader
・Selected for the second year in a row as a Nadeshiko Brand by the Ministry of Economy, Trade and Industry as a company that ably promotes active roles for women
・Selected for inclusion in the MSCI Japan Empowering Women (WIN) Select Index for the sixth consecutive year
|
Challenging towards expanding new fields
'Initiatives that contribute to the creation of new industries by enhancing the industrial creation platform.'
|
| Coexist with the environment *1 |
Progress of the Group Action Plan to realize a Decarbonized Society |
Annual disclosure of initiatives |
- |
- |
- |
- |
- |
Increase in green space, forest utilization
'Initiatives to increace urban greenery through development and to regenerate Japan's forests.'
|
| CO2 and other emission reduction rate (1,000 t-CO2) |
By FY2030
By FY2050 |
: 40% decrease compared to FY2019
: Virtually zero |
4,690 |
4,199 |
5,503 |
+1,304 (+31.1%) |
Compared to FY2019:
+1,120 (+25.6%)
Increased due to an increase in completed/sold properties, etc. |
| Proportion of electric power used in business activities derived from renewable energy (RE100) |
By FY2050 |
100% |
0.1% |
3.0% |
11.3% |
+8.3% |
Improved through active use of renewable energy |
| New building external environment certification acquisition rate*3 |
Annual |
100% |
- |
- |
- |
- |
|
| Energy consumption per base unit (kℓ/m2 per year) |
Annual |
1% reduction annually |
0.035 |
0.039 |
0.039 |
0.0% |
Due to increased activity by people as the effects of the pandemic lessen |
| Clean/industrial water use per base unit (m3/m2 per year) |
Annual |
Less than the previous fiscal year |
0.708 |
0.671 |
0.855 |
+27.4% |
Due to increased activity by people as the effects of the pandemic lessen and the increase in the number of buildings that the indicators cover
*For FY2019 and FY2020, which buildings are covered by these indicators is based on the Act on the Rational Use of Energy; for FY2021 onward, the number of buildings covered has increased to include those covered by Science-Based Targets (SBTs) |
| General waste emissions per base unit (t/m2 per year) |
Annual |
0.0044 |
0.0055 |
0.0059 |
+7.3% |
| Industrial waste emissions per base unit (t/m2 per year) |
Annual |
0.0010 |
0.0011 |
0.0016 |
+45.5% |
| Waste recycling ratio (at Mitsui Fudosan Co., Ltd. headquarters) |
By FY2030 |
90% |
75.3% |
72.4% |
69.1% |
3.3% decrease |
Paper waste (which can be recycled) is decreasing as we move to paperless operations; the amount of waste that cannot be recycled, meanwhile, has plateaued. Moreover, the total amount of waste is decreasing. |
| Health and vitality *2 |
Improving experiential value
'Initiatives towards creating neighborhood that people are inspired to visit by delivering an emotional experience.'
|
Annual disclosure of initiatives |
- |
- |
- |
- |
- |
Realizing a Well-Being Society
'Initiatives to realize a healthy and vibrant society for workers and visitors.'
|
| Number of paid leave days taken |
Annual |
14 days annually |
13.8 days |
15.0 days |
16.2 days |
+1.2 day |
Increased due to the setting and publicizing of recommended leave days, and recommendation communication to relevant individuals or their immediate superiors |
| Health checkup and screening rate |
Annual |
100% |
99.5% |
100% |
100% |
0.0% |
|
| Safety and security |
Safety and security
'Initiatives to realize a safe and secure society from both tangible and intangible perspectives.'
|
Annual disclosure of initiatives |
- |
- |
- |
- |
- |
| Implementation of disaster preparedness training, including tenant companies |
Biannual implementation |
| Diversity and inclusion *2 |
Realizing an inclusive society
'Initiatives to realize a society in which all people can maximize their abilities and play an active role.'
|
Annual disclosure of initiatives |
- |
- |
- |
- |
- |
| Employee engagement *4 |
Annual |
80% or more |
- |
- |
92% |
- |
Added as a KPI for FY2023 onward |
| Training time per employee *5 |
Annual |
Same level as previous year's results |
- |
- |
28.2 hours |
- |
Added as a KPI for FY2023 onward |
| Training expenses per employee *6 |
Annual |
Same level as previous year's results |
- |
- |
131,000 yen |
- |
Added as a KPI for FY2023 onward |
| Women in management positions ratio *7 |
By 2025
By 2030 |
:10%
:20% |
5.7% |
6.8% |
7.7% |
+0.9% |
Active recruitment of mid-career personnel and internal promotion to management positions contributed to improvements |
| Ratio of female hires |
Annual |
40% |
- |
40.5% |
44.1% |
+3.6% |
Added as a KPI for FY2021 onward |
| Employment rate of people with disabilities (legal employment rate) *8 |
Annual |
2.5%
or more |
2.07% |
2.14% |
2.52% |
+0.38% |
Active recruitment of people with disabilities contributed to improvements |
| Percentage of male employees taking childcare leave, etc *9 |
Annual |
100% |
- |
- |
122.9% |
- |
Added as a KPI for FY2022 onward |
| Return rate from childcare leave |
Annual |
100% |
100% |
100% |
100% |
0.0% |
100% for 23 consecutive years |
| Compliance and governance *2 |
Compliance training attendance ratio |
Annual |
100% |
- |
- |
- |
- |
| Implementation and enhancement of Human Rights Due Diligence |
Annual |