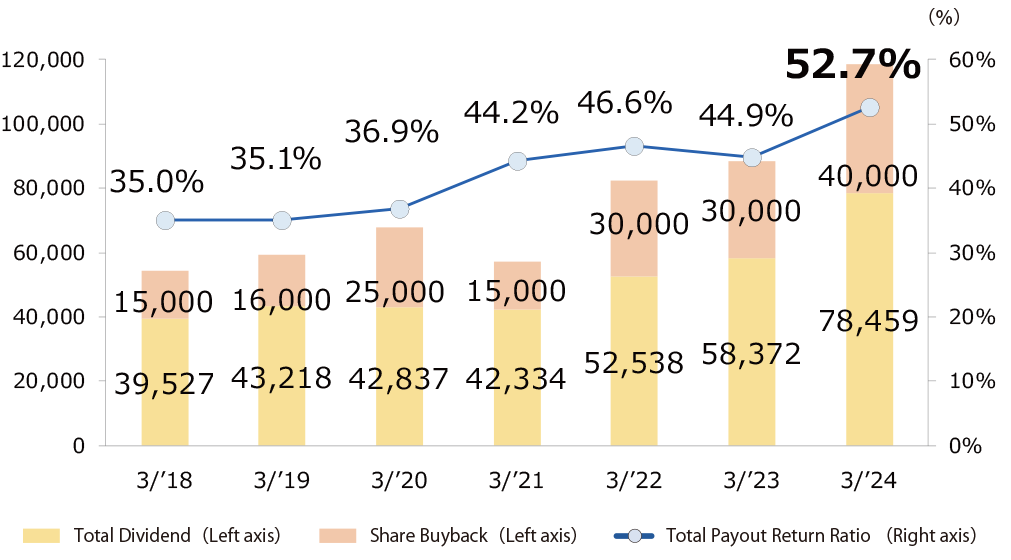
Total payout return ratio 50% or higher each period
Dividend payout ratio Around 35% each period
Stable dividend increases linked to sustainable profit growth
(continuous and progressive dividends)
Flexible and continuous repurchase of own shares
Status of Shareholder Returns
Trends in Profit Attributable to Owners of Parent and Dividends per Share
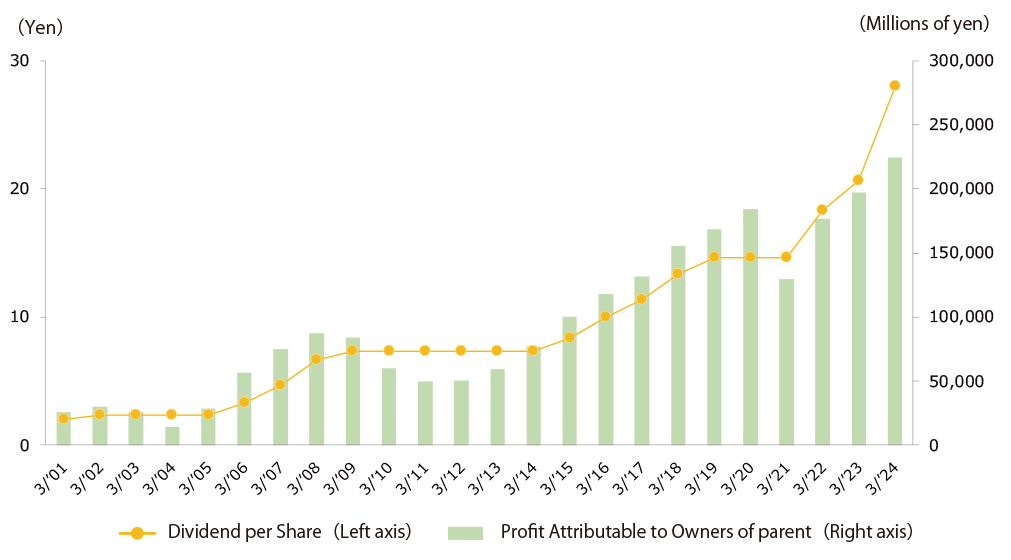
* Annual dividend per share is adjusted after the stock split (from 1 share to 3 shares) implemented on 4/1/2024 and rounded to the nearest whole number.
Trends in Total Dividend Amount, Share Repurchase Amount, Dividend Payout Ratio, Total Payout Return Ratio
SCROLL
| Year Ended March 31 |
FY2017 |
FY2018 |
FY2019 |
FY2020 |
FY2021 |
FY2022 |
FY2023 |
FY2024 |
FY2025 |
| Total Payout Return Ratio(%) |
35.0 |
35.1 |
36.9 |
44.2 |
46.6 |
44.9 |
52.7 |
52.7 |
54.9 |
Consolidated Total
Dividend payout ratio (%) |
25.4 |
25.7 |
23.4 |
32.7 |
29.8 |
29.8 |
34.9 |
34.7 |
34.6 |
Share Repurchase Amount
(Millions of yen) |
15,000 |
16,000 |
25,000 |
15,000 |
30,000 |
30,000 |
40,000 |
45,000 |
57,000 |
Total Dividend Amount
(Millions of yen) |
39,527 |
43,218 |
42,837 |
42,334 |
52,538 |
58,372 |
78,459 |
86,152 |
96,047 |
| Dividends per Share (Yen)* |
13 |
15 |
15 |
15 |
18 |
21 |
28 |
31 |
35 |
*Annual dividend per share is adjusted after the stock split (from 1 share to 3 shares) implemented on 4/1/2024 and rounded to the nearest whole number.