Highlights of FY2025 Financial Results
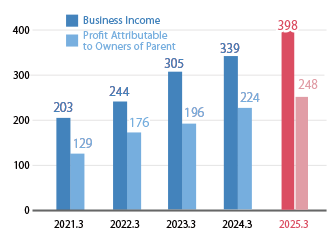
For the current fiscal year, revenue from operations increased by ¥84.3 billion, or 3.2%, compared to the previous fiscal year, business income increased by ¥46.4 billion, or 11.6%, ordinary income increased by ¥23.0 billion, or 7.9%, and net income attributable to shareholders of the Company increased by ¥29.8 billion, or 12.0%. Furthermore, revenue from operations, business income, ordinary income, and net income attributable to shareholders of the Company all reached record highs. Revenue from operations and business income have reached record highs for 14 and 2 consecutive fiscal years, respectively. Ordinary income and net income attributable to shareholders of the Company have reached record highs for 4 consecutive fiscal years.
Consolidated Five-Year Summary
(Millions of yen)
SCROLL
Years Ended March 31 |
2022 |
2023 |
2024 |
2025 |
2026 |
| Revenue and Earnings |
|---|
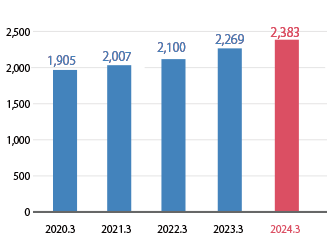
| Revenue from Operations |
2,100,870 |
2,269,103 |
2,383,289 |
2,625,363 |
2,709,747 |
|---|
| Business Income (*1) |
244,978 |
305,405 |
339,690 |
398,688 |
445,120 |
|---|
| Ordinary Income |
224,940 |
265,358 |
267,890 |
290,262 |
313,319 |
|---|
Profit Attributable
to Owners of Parent |
176,986 |
196,998 |
224,647 |
248,799 |
278,684 |
|---|
| Financial Position |
|---|
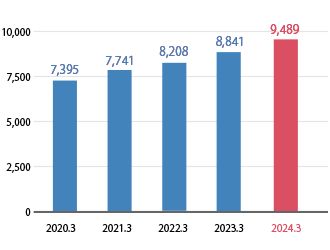
| Total Assets |
8,208,012 |
8,841,396 |
9,489,527 |
9,859,856 |
10,103,474 |
|---|
Real Property for Sale
(*2) |
2,051,704 |
2,163,634 |
2,375,281 |
2,500,757 |
2,603,087 |
|---|
Tangible and Intangible
Fixed Assets |
3,914,135 |
4,293,130 |
4,405,526 |
4,707,418 |
4,679,110 |
|---|
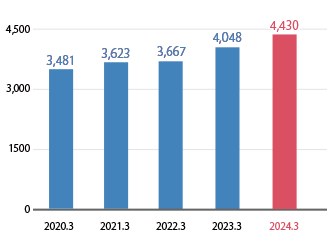
Interest-Bearing Debt
(*3) |
3,667,234 |
4,048,531 |
4,430,422 |
4,416,086 |
4,632,547 |
|---|
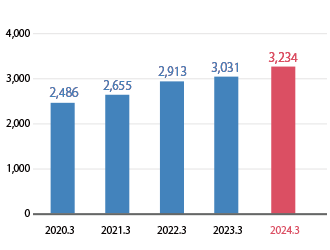
| Net Assets |
2,913,752 |
3,031,220 |
3,234,656 |
3,270,723 |
3,384,844 |
|---|
| Cash Flows |
|---|
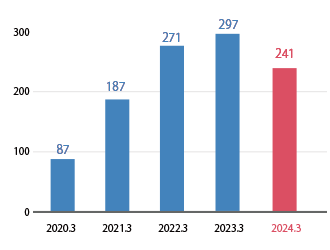
Cash Flow from
Operating Activities |
271,469 |
297,708 |
241,697 |
599,252 |
145,270 |
|---|
Cash Flow from
Investing Activities |
(210,057) |
(422,034) |
(286,987) |
(321,970) |
(179,014) |
|---|
Cash Flow from
Financing Activities |
(139,600) |
111,448 |
59,988 |
(269,367) |
(59,118) |
|---|
| Free Cash Flow (*4) |
61,412 |
(124,326) |
(45,290) |
277,282 |
(33,744) |
|---|
| Per Share Data |
|---|
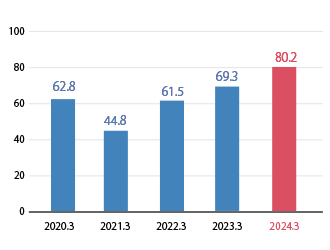
Earnings per Share
(Yen)(*5) |
61.5 |
69.3 |
80.2 |
89.3 |
101.0 |
|---|
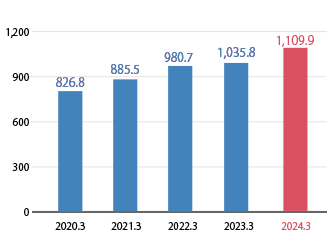
Net Assets per Share
(Yen)(*5) |
980.7 |
1,035.8 |
1,109.9 |
1,135.1 |
1,206.1 |
|---|
Annual Dividend per Share
(Yen)(*5) |
18 |
21 |
28 |
31 |
35 |
|---|
| Key Management Indices |
|---|
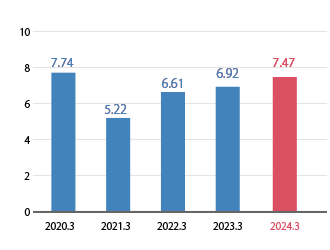
Return on Equity
(%)(*6) |
6.61 |
6.92 |
7.47 |
7.95 |
8.68 |
|---|
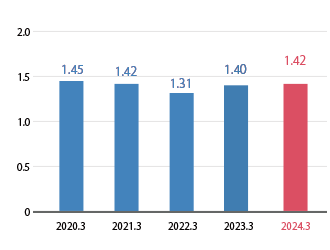
Debt/Equity Ratio
(Times)(*7) |
1.31 |
1.40 |
1.42 |
1.40 |
1.41 |
|---|
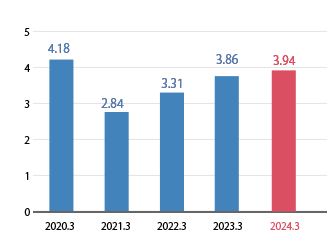
Return on Assets
(%)(*8) |
3.31 |
3.86 |
3.94 |
4.12 |
4.46 |
|---|
| Equity Ratio (%) |
34.1 |
32.8 |
32.8 |
31.9 |
32.4 |
|---|
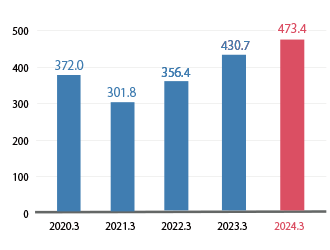
| EBITDA (Billion of yen)(*9) |
356.4 |
430.7 |
473.4 |
513.2 |
548.7 |
-
*1
Operating income is disclosed for FY2023 and prior.
-
*2
Real Property for Sale: Real Property for Sale + Real Property for Sale in Progress + Land for Development + Advances Paid for Purchases
-
*3
Interest-Bearing Debt: Short-Term Debt + Commercial Paper + Bond Redeemable within One Year + Corporate Bonds + Long-Term Debt
-
*4
Free Cash Flow: Cash Flows from Operating Activities + Cash Flows from Investing Activities
-
*5
The Company conducted a 3-for-1 stock split for common shares, and calculated the figures for fiscal years prior to fiscal year 2022 as if the stock split had been conducted at the beginning of the previous fiscal
-
*6
ROE: Profit Attributable to Owners of Parent/Average shareholders' equity over period
-
*7
Debt/Equity Ratio: Interest-Bearing Debt/Shareholders' equity
-
*8
~FY2023:ROA=(Operating income + non-operating income)/average total assets over period
FY2024~:ROA=Business income/average total assets over period
-
*9
EBITDA: Operating income +Depreciation
Revenue and Earnings
Financial Position
-
Total Assets(Billions of yen)
-
Interest-Bearing Debt(Billions of yen)
-
Net Assets(Billions of yen)
Cash Flow
-
Cash Flow from
Operating Activities(Billions of yen)
Per Share Data
-
Earnings per Share(Yen)
-
Net Assets per Share(Yen)
Key Management Indecies
-
ROE(%)
-
Debt/Equity Ratio(Times)
-
ROA(%)
-
EBITDA(Billion of yen)